- To: "Douglas Miller" <dmiller@xxxxxxxx>, gembud <gembud@xxxxxxxxxxxxxxxx>
- Subject: Re: [gembud] plotting line segments (e.g., trough and ridge lines) via GEMPAK
- From: "Patrick L. Francis" <wxprofessor@xxxxxxxxx>
- Date: Fri, 30 Sep 2022 15:50:48 +0000
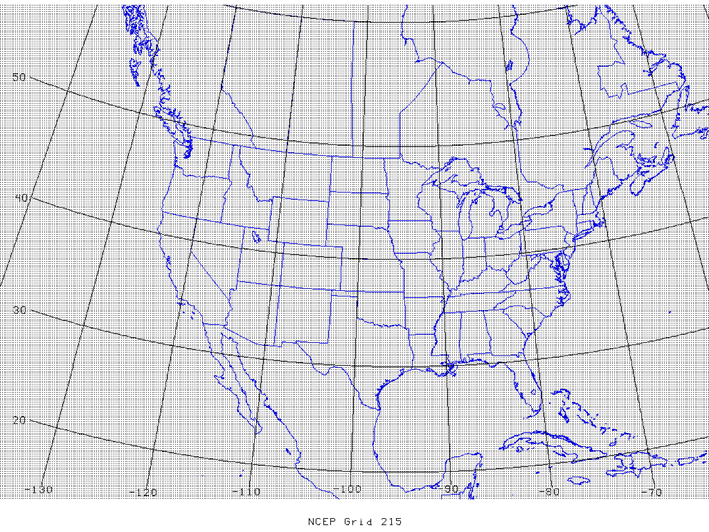
Is there a way one can specify lat/lon points and tell GEMPAK to "connect the dots" to draw line segments? I'm interested in showing spatial ranges of trough and ridge lines for a variety of case studies on a background map.I used to do something similar with my students... very easy to accomplish with latlon, since there are a myriad of specifications available... also helpful in teaching projections:
https://docs.unidata.ucar.edu/gempak/man/parm/latlon.html

Looks like below:
cheers,

--patrick
- References:
- [gembud] plotting line segments (e.g., trough and ridge lines) via GEMPAK
- From: Douglas Miller
- [gembud] plotting line segments (e.g., trough and ridge lines) via GEMPAK