Hi-
小代 wrote:
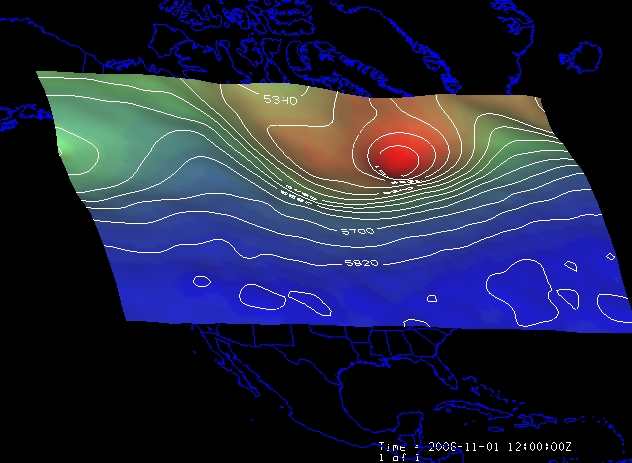
> Dear guys: I want to make a plot like
> http://www.unidata.ucar.edu/software/idv/gallery/3d500mb.jpg. So
> what's the way to do that? Thanks!
You'll need a grid with a 3D geopotential height grid. Use the
3D Surface->Color Shaded Plan View over topography display and
when prompted for the topography grid, select the geopotential
height grid again. Then set the level to be 500 mb (or whatever
level you want).
You'll need to set the vertical range of the display to exaggerate
the topography. You can use the View->Viewpoint->Vertical Scale
menu in the View Window.
If you want contours also, just load in another display, selecting
3D Surface->Contour Plan View Over Topography. You can also
use another field for the main variable (like Temperature) and
select the geopotential height grid when prompted for topography.
At this point, you need to select at least 3 levels in the levels
tab if you want to subset the grid in the vertical dimension.
Good luck!
Don
*************************************************************
Don Murray UCAR Unidata Program
dmurray@xxxxxxxxxxxxxxxx P.O. Box 3000
(303) 497-8628 Boulder, CO 80307
http://www.unidata.ucar.edu/staff/donm
*************************************************************