If the IDV shows the nearest available time, the 6Z-9Z display change would
appear from 7Z to 8Z in the list of times.
Is that what is puzzling you?
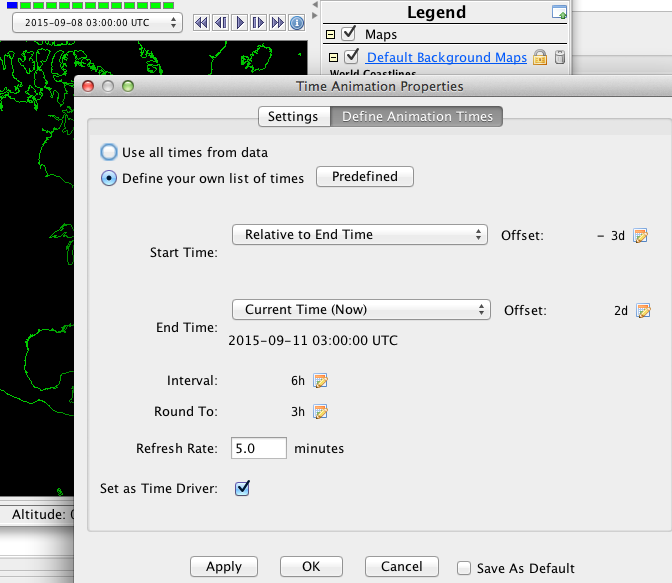
Perhaps defining your own list of times will get you what you want. I often use
that to set the Time Driver, then use Time Driver to sample datasets at the
desired times. Click the little "i" near the animation controller to get the
Time Animation Properties dialog. Apologies if this is too elementary to
address your question.
Brian Mapes
[cid:25887FCF-096B-4F00-9F4A-AA8B91A48EF4@attlocal.net]
On Sep 8, 2015, at 4:20 PM, Michael Muratet wrote:
Greetings
I am a newby. I would like to display two gridded (GRIB2) data sources. One is
on 3 hour centers and the other is one that I have interpolated in time to 1
hour centers. The files are large, but I can make them available.
After adding the 1 hr file, the time control shows the 1 hr spacing. I expected
that the 3 hr display would only change every three hours, but it changes at
8:00Z instead of 9:00Z, for example.
I can’t find anything in the user’s guide that says this is possible or how to
do it if it is. Is it possible? Will IDV try to interpolate to make time points
line up?
Thanks
Mike
_______________________________________________
idvusers mailing list
idvusers@xxxxxxxxxxxxxxxx<mailto:idvusers@xxxxxxxxxxxxxxxx>
For list information, to unsubscribe, visit:
https://urldefense.proofpoint.com/v2/url?u=http-3A__www.unidata.ucar.edu_mailing-5Flists_&d=BQIGaQ&c=y2w-uYmhgFWijp_IQN0DhA&r=yVke5Cs8_Mo0wii3NwoEZW87DUrnvGv6PU94kU0W0P0&m=coJS3-We6SwoMbJgA8KLkGUrPGrqSBybfQQYINQrw_Q&s=-EnvQPYRzO9CqUeIzwWbPk87jmpzp5pS0UwRGAMcjKU&e=
Brian Mapes
bmapes@xxxxxxxxxxxxxxx<mailto:bmapes@xxxxxxxxxxxxxxx>