Has anyone noticed dataflow issues with HRRR and RTMA lately via NOAAPort?
I'm an HRRR nut, so I kind of pay closer attention than most people might ,
but over the last few weeks / months we've had NCEP ftp issues that we've
worked through, but I use as much data as I can that comes over our dishes,
so I don't need to wget them, and was ever so happy when HRRR was added to
NOAAPort! Woohoo!
So I thought it might be good to compare receipt times of HRRR and for fun
RTMA on two of my dishes that are in different physical locations, and see
how they look:
Here is one of my Coon boxes (For Coon Rapids, MN - a northern suburb of
MSP) with a directory listing of HRRR F001 receipt times:
http://modelweather.com/files/noaaport/noaaport.hrrr.coon.2016.03.10.png
Notice highlighted that the 00z HRRR run through 23z run all came in at the
1900 hour, and the same has started this evening where 19-21Z are all coming
in right after 5pm.
To compare HRRR receipt times, notice we see the same thing with RTMA
http://modelweather.com/files/noaaport/noaaport.rtma.coon.2016.03.10.png
The reason I did this comparison, is that if both model products appear to
have a "bottleneck" in receipt times, this bottleneck must either be at the
production end, the uplink, or the downlink sites. On a production side,
I've always "Assumed" that if a production issue were to occur, that
forecast run would simply be bypassed, and move along to the next hour in a
cycle instead of running repeat products, but then that is of course only my
assumption, on how I have run my products in the past.
So to compare, I decided to look at my EP Dish (Eden Praries, MN - a western
suburb of MSP)
I don't keep as many hours on this box, so we can't look back at yesterday,
but for today, we see a bottleneck occurring at the same time (this box is
CST).. notice between noon and 1500 CST, zero HRRR runs were received, then
the hounds were released
http://modelweather.com/files/noaaport/noaaport.hrrr.511.2016.03.10.png
Now to compare RTMA, we see the exact same thing:
http://modelweather.com/files/noaaport/noaaport.rtma.511.2016.03.10.png
So in conclusion, we have two models coming over NOAAPort that appear to
have reached a bottleneck either in production, uplink, or downlink, as both
models show lag in receipt time within the same time frame. One possible
explanation would be a bottleneck from the uplink, which may make sense as
we have had NCEP network issues over the last few months. The reason I feel
that it is either production, or the uplink, is I have tested a completely
different geographically unique location, with entirely different networking
and equipment, and noted the same issue in each of these locations.
Has anyone noticed something similar?
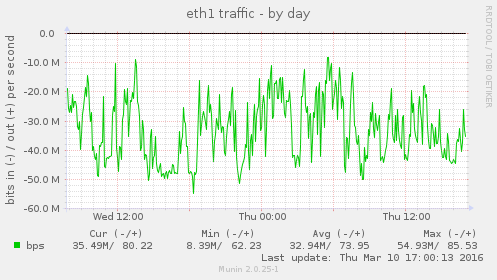
On a side note I have notice fascinating volume changes on the amount of
data coming through NOAAPort, as I chart everything .
Volume seems to be peaking out around 50mbps and the times are interesting
to compare to the lags.. Here is a quick chart
And as always if you wish to view NOAAPort volumes live, you may do so from
the top of my personal site here:
http://modelweather.com/
Cheers,
-patrick
-------------------------------------------------------
Patrick L. Francis
Vice President of Research & Development
Aeris Weather
http://aerisweather.com/
http://modelweather.com/
http://facebook.com/wxprofessor/
--------------------------------------------------------


