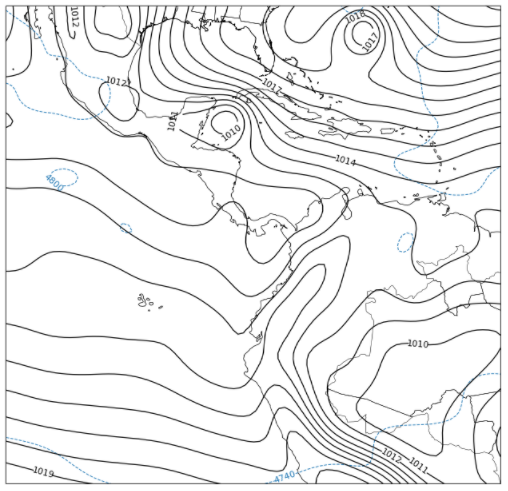
Hello.I made an example of the surface chart linking
https://github.com/Unidata/python-training/blob/master/pages/gallery/HILO_Symbol_Plot.ipynb,
but the Thredds catalog has data from 2014 and not data from August 2021. I
also have problems with the pressure levels because the colors of the high
and low pressures are not displayed.

Could you please show me an example of a surface chart for the area, but
with data from August 23?

Thank you very much for your collaboration and I remain attentive to your
instructions.

[image: image.png]

--
Alexander M. Martínez Mercado
Lic. en Química
Universidad Distrital Francisco José de Caldas
MSc en Ciencias - Meteorología
Universidad Nacional de Colombia
Docente MT UECCI
OSPA - IDEAM