- To: python-users@xxxxxxxxxxxxxxxx
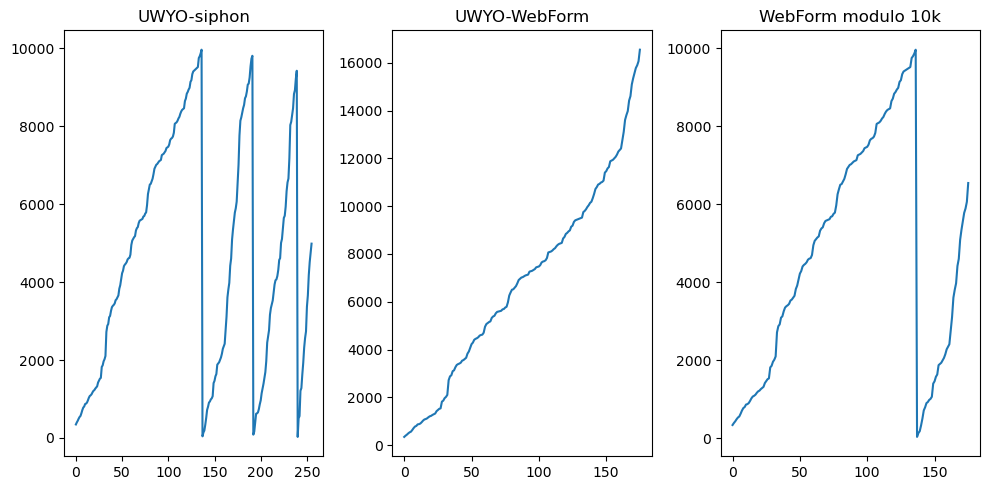
- Subject: [python-users] Siphon/MetPy: Invalid height data read from U of Wyoming RAOBs
- From: Geoffrey Lewen <geoffreylewen@xxxxxxxxx>
- Date: Tue, 23 May 2023 00:24:23 -0500
- Follow-Ups:
NOTICE: This version of the NSF Unidata web site (archive.unidata.ucar.edu) is no longer being updated.
Current content can be found at unidata.ucar.edu.