Hi All,
In the 23.4.1 build of AWIPS2 we *finally* have access to the MetPy
package. Huzzah!
I was really excited to be able to use the parse_metar_to_dataframe()
method in MetPy.
I'm curious what the best way is to create a timeseries using this method.
If I have a list of METAR strings, I'd like to parse them into a dataframe.
For now I've been doing the following:
df = None
if len(metars):
df = parse_metar_to_dataframe(metars[0])
if len(metars) > 1:
for i in range(1, len(metars)):
print("\t",i)
*df = df.append(parse_metar_to_dataframe(metars[i]))*
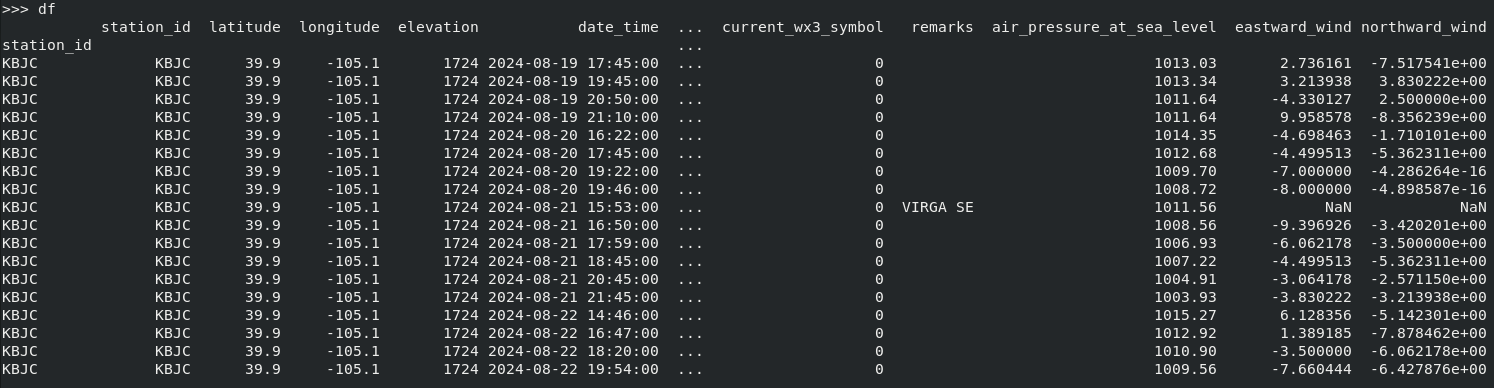
This gives me what I'm aiming for:
[image: image.png]
But I've read that pandas is getting rid of the DataFrame.append() method
due to its inefficiency. The suggestion is to concat() instead
df = None
if len(metars):
df = parse_metar_to_dataframe(metars[0])
if len(metars) > 1:
for i in range(1, len(metars)):
print("\t",i)
*df = pd.concat([df, parse_metar_to_dataframe(metars[i])])*
This method of using *concat* also works! All is good!
However, the prefered method is, apparently, to create a list of
dictionaries and then create your dataframe from that list.
To implement this while still utilizing the
awesome parse_metar_to_dataframe, it seems that I would need to convert the
dataframe returned from parse_metar_to_dataframe to a dict and append it to
a list.
The dict returned from parse_metar_to_dataframe(metars[i]).to_dict() looks
like
{'station_id': {'KBJC': 'KBJC'}, 'latitude': {'KBJC': 39.9}, 'longitude':
{'KBJC': -105.1}, 'elevation': {'KBJC': 1724}, 'date_time': {'KBJC':
Timestamp('2024-08-19 17:45:00')}, 'wind_direction': {'KBJC': 340},
'wind_speed': {'KBJC': 8.0}, 'wind_gust': {'KBJC': nan}, 'visibility':
{'KBJC': 16093.44}, 'current_wx1': {'KBJC': nan}, 'current_wx2': {'KBJC':
nan}, 'current_wx3': {'KBJC': nan}, 'low_cloud_type': {'KBJC': 'SCT'},
'low_cloud_level': {'KBJC': 12000.0}, 'medium_cloud_type': {'KBJC': 'BKN'},
'medium_cloud_level': {'KBJC': 20000.0}, 'high_cloud_type': {'KBJC': nan},
'high_cloud_level': {'KBJC': nan}, 'highest_cloud_type': {'KBJC': nan},
'highest_cloud_level': {'KBJC': nan}, 'cloud_coverage': {'KBJC': 6},
'air_temperature': {'KBJC': 29.0}, 'dew_point_temperature': {'KBJC': 9.0},
'altimeter': {'KBJC': 30.3}, 'current_wx1_symbol': {'KBJC': 0},
'current_wx2_symbol': {'KBJC': 0}, 'current_wx3_symbol': {'KBJC': 0},
'remarks': {'KBJC': ''}, 'air_pressure_at_sea_level': {'KBJC': 1013.03},
'eastward_wind': {'KBJC': 2.736161146605349}, 'northward_wind': {'KBJC':
-7.517540966287267}}
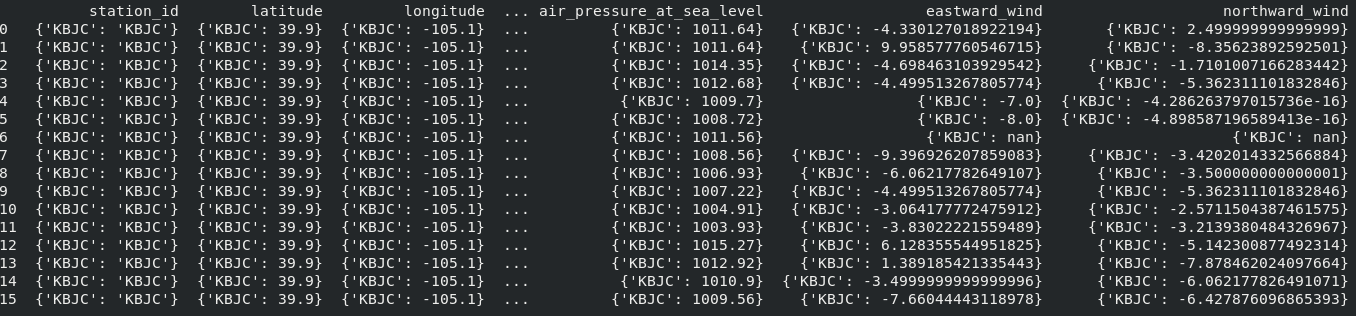
Which results in a DataFrame that looks like this:
[image: image.png]
This is definitely not what I'm looking for as I can't perform any analyses
on these series.
*So my question is*: what is the best way to create a timeseries of metar
data using the parse_metar_to_dataframe() method in MetPy?
Maybe I need to do some work with the to_dict() to straighten things out?
I'm sure there are other strategies I'm missing. If anyone can help, I
would greatly appreciate it. I'm trying to future proof this code as much
as I can.
Thanks much!
-kevin.
--
Kevin L. Manross
Colorado State University/Cooperative Institute for Research in the
Atmosphere (CIRA)
Stationed at NOAA/Global Systems Laboratory
+ Weather Informatics and Decision Support Division (WIDS)
++ Weather Information Systems Evolution (WISE)
325 Broadway, Boulder, CO 80305
(307) 463-1117 | DSRC Room 3C124
The contents of this message are mine personally and do not necessarily
reflect any position of CIRA/CSU or NOAA