- To: <visad-list@xxxxxxxxxxxxx>
- Subject: Axis Title Overlaps Axis Tick Labels
- From: "Luke A. Catania \(TEC\)" <lcatania@xxxxxxxxxxxx>
- Date: Wed, 3 Apr 2002 06:30:48 -0500
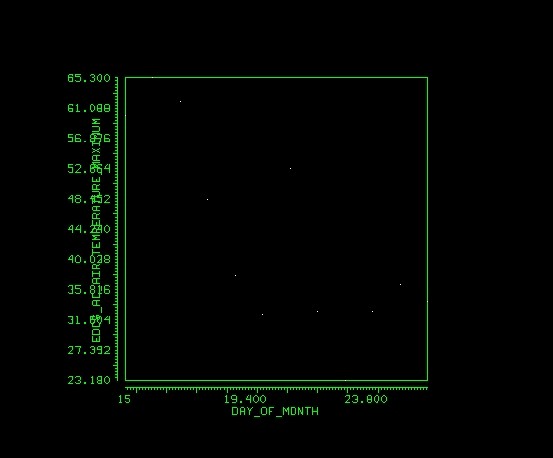
The Y Axis title is written to close to the axis, so when my axis has its
tick marks labeled, the title & tick labels are unreadable because the tick
labels and axis titles overlap each other.  Is there a way to move the axis
title or can the visAD code that places the label, be fixed so that it
calculates the distance from the Y-Axis to include the Tick labels, so that
no matter if you have a small tick label value or large values, the title is
adjusted to account for that.

It's been a subject among the users of my application, because they cannot
make their graphs presentable to be put in viewgraphs for their briefings.

I asked this question about six month ago and found and answer in the
archives, but it does not seem to really help me with my problem.  I thought
there was another response, but can not find it in the list on line. And
also maybe this has been fixed in a new version of visAD, but I have the
latest and did not see it fixed.

Luke
Attachment:
midfrocal.jpg
Description: JPEG image
- Follow-Ups:
- Re: Axis Title Overlaps Axis Tick Labels
- From: Don Murray
- Re: Axis Title Overlaps Axis Tick Labels