Attached is a test program and a gif image.
The program is a demo of a synthetic radar RHI display, a vertical cross
section in 3D space of radar sweep data with one end on the radar
location so the beams fan out from the radar in a vertical plane. The
code uses the Australian BOM's Radar3DCoordinateSystem. The coodinate
system and data location is fine.
The display shows each data point along the radar beams as a pixel
colored by value.
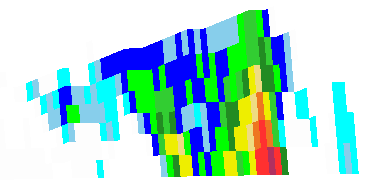
A similar display in 2D shows interpolated color filled regions like the
attached gif.
Why doesn't the 3D display make a color filled surface? Can it be made
to do so?
Stu Wier
Unidata
import visad.*;
import visad.java3d.DisplayImplJ3D;
import java.rmi.RemoteException;
import java.awt.*;
import javax.swing.*;
import visad.bom.Radar3DCoordinateSystem;

import visad.georef.EarthLocationTuple;


/* Demo 3d display of synthetic RHI plot of radar data,
   (vertical cross section with one end at radar),
   using Australian BOM's Radar3DCoordinateSystem */

public class Plot_radar3dVCS {

    private DataReferenceImpl data_ref;

    private DisplayImpl display;


    public Plot_radar3dVCS (String []args)
        throws RemoteException, VisADException {

        int bin_count = 50;// number of samples along each radar beam
        int tiltcount = 8; // how many beams in this one RHI
        int value_counter = bin_count * tiltcount;

        // Make synthetic domain and range values for radar-like data
        float[][] domainVals = new float[3][value_counter];
        float[][] signalVals = new float[1][value_counter];
        int k = 0;
        // for every tilt (beam) in this rhi
        for (int ti = 0; ti<tiltcount; ti++) {
            // for every data point along the beam
            for (int i = 0; i < bin_count;   i++) {
                // range in km
                domainVals[0][k] = 1.0f * i;
                // azimuth in degree - 60 clockwise from North
                domainVals[1][k] = 45.0f;
                // bema elevation in degrees
                domainVals[2][k] = 2.0f * ti;
                // synthetic data values 0 to 80 dbz
                signalVals[0][k] = 25.0f * 55.0f / (25.0f + 3*Math.abs(25-i));
                k++;
            }
        }

        // locate near Denver lat, lon, alt=1600 m
        EarthLocationTuple radarLocation =
            new EarthLocationTuple(40.0, -105.0, 1600.0);

        RealType azimuthType =
            RealType.getRealType("Azimuth", CommonUnit.degree);
        RealType rangeType =
            RealType.getRealType("Range", CommonUnit.meter);
        RealType elType =
            RealType.getRealType("Elevation_Angle", CommonUnit.degree);

        CoordinateSystem cs =
          (radarLocation == null)
            ? null
            : new Radar3DCoordinateSystem(
               (float) radarLocation.getLatitude().getValue(CommonUnit.degree),
               (float)radarLocation.getLongitude().getValue(CommonUnit.degree),
               (float) radarLocation.getAltitude().getValue(CommonUnit.meter));
        RealTupleType radarDomainType =
            new RealTupleType(rangeType, azimuthType, elType, cs, null);

        //System.out.println("   domainSet CoordinateSystem = "
        //                 + radarDomainType.getCoordinateSystem());

        GriddedSet domainSet =
            (GriddedSet) new Gridded3DSet(radarDomainType, domainVals,
                             bin_count, tiltcount, 1,
                             radarDomainType.getCoordinateSystem(),
                             new Unit[] {CommonUnit.meter.scale(1000),
                                         CommonUnit.degree,
                                         CommonUnit.degree},
                             (ErrorEstimate[]) null, true, false);

        RealType refType = RealType.getRealType("Reflectivity");

        FunctionType functionType =
            new FunctionType(radarDomainType, refType);
        // should be ((Range, Azimuth, Elevation_Angle) -> Reflectivity) or so

         FlatField retField =
           new FlatField(functionType, domainSet,
                         (CoordinateSystem) null,
                         (Set[]) null,
                         (Unit[]) null);

        retField.setSamples(signalVals, false);


        /* Create the display and its ScalarMaps. */

        /* Make a 3D display object */
        display = new DisplayImplJ3D("notused");

        /* Get the display's graphics mode control */
        GraphicsModeControl dispGMC = (GraphicsModeControl)
            display.getGraphicsModeControl();

        /* tell the display to mark some scales along edges */
        dispGMC.setScaleEnable(true);
        dispGMC.setPointMode(false);


        /* Create the ScalarMaps */

        /* Map latitude to YAxis, longitude to XAxis.
         * Use ScalarMap(ScalarType scalar, DisplayRealType display_scalar.
         * note the use of the RealTypes to define mapping */
        ScalarMap YMap = new ScalarMap( RealType.Latitude,  Display.YAxis );
        ScalarMap XMap = new ScalarMap( RealType.Longitude, Display.XAxis );
        ScalarMap ZMap = new ScalarMap( RealType.Altitude,  Display.ZAxis );

        /* Add the ScalarMaps controlling the the axes to the display. */
        display.addMap( XMap );
        display.addMap( YMap );
        display.addMap( ZMap );

        ScalarMap colorMap = new ScalarMap( refType,  Display.RGB );

        display.addMap(colorMap);


        /* Create a data reference to connect the FlatField to the display */
        data_ref = new DataReferenceImpl("data_ref");

        /* add the FlatField to the DataReferenceImpl */
        data_ref.setData( retField );

        /* Add the DataReferenceImpl to the display */
        display.addReference( data_ref );

        /* Create application window, and add the display to the window
         * (name in quotes will label the window.) */
        JFrame jframe = new JFrame("VisAD Radar RHI");
        jframe.getContentPane().add(display.getComponent());

        /* Set the original window size (pixels) */
        jframe.setSize(600, 600);

        /* Finally, show the display. */
        jframe.setVisible(true);

        // When displayed, dragging mouse button one rotates the display;
        // dragging mouse button one with the shift key down zooms in and out;
        // dragging mouse button one with the control key down pans the display
       }


  public static void main(String[] args)
    throws RemoteException, VisADException
  {
    new Plot_radar3dVCS (args);
  }

}