Ian:
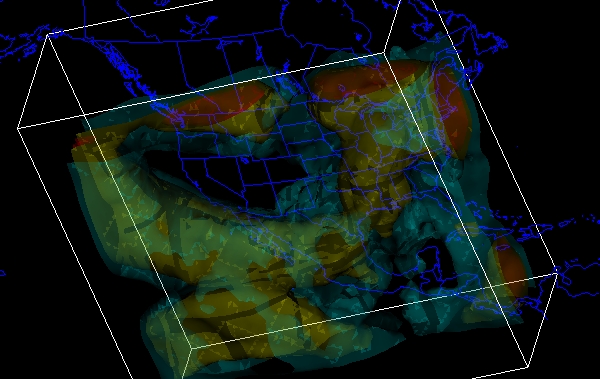
An example of this using the IDV (because it allows me to do it quickly using
VisAD) is at:
http://www.ssec.wisc.edu/~tomw/iso.jpg
using windspeed from the latest RUC initialization: 20mps is cyan, 30mps is
yellow, and 35mpg is red. I set the transparancy of each color to 80%.
tom


Ian Barrodale wrote:
Hi All:
We have a 3D volume data set which we'd like to visualize as a set of
transparent colored isosurfaces simultaneously rendered into a single
view. For example, if our data was temperatures in a volume above a
city, we'd like to see a blue isosurface for 10C, a cyan isosurface for
15C, a green isosurface for 20C, an orange isosurface for 25C, and a red
isosurface for 30C. The mental image is a field of colored soap bubbles.
Can we use VisAD to do such a visualization, or even more attractive,
will the spreadsheet or other tools do this without additional programming?
Thanks,
Ian

**********************************************
Ian Barrodale, Ph.D.
President
Barrodale Computing Services Ltd.
Tel: (250) 472-4372 Fax: (250) 472-4373
Web: _http://www.barrodale.com_ <http://www.barrodale.com/>
Email: ian@xxxxxxxxxxxxx
**********************************************
Mailing Address:
P.O. Box 3075 STN CSC
Victoria BC Canada V8W 3W2

Shipping Address:
Hut R, McKenzie Avenue
University of Victoria
Victoria BC Canada V8W 3W2
**********************************************
--
Tom Whittaker (tomw@xxxxxxxxxxxxx)
University of Wisconsin-Madison
Space Science and Engineering Center
Cooperative Institute for Meteorological Satellite Studies
Phone/VoiceMail: 608.262.2759