Hi,
I've been looking at the quality of streamline analyses (of atmospheric
wind fields) lately.
I was experimenting with streamline displays in the McIDAS system, and
thought (IMHO) that the streamline analyses looked better as the density
of the streamlines increased.
I then tried to increase the density of the streamlines in a visad
display, and but wasn't able to generate the same density as the McIDAS
display.
Should I be able to do this? If so how?
Tried changing "streamlineDensity" from the default of 1.0 to higher
values of 10.0, 100.0, 1000.0 and 1000.0, but didn't notice much change
beyond 100.0.
Further details:
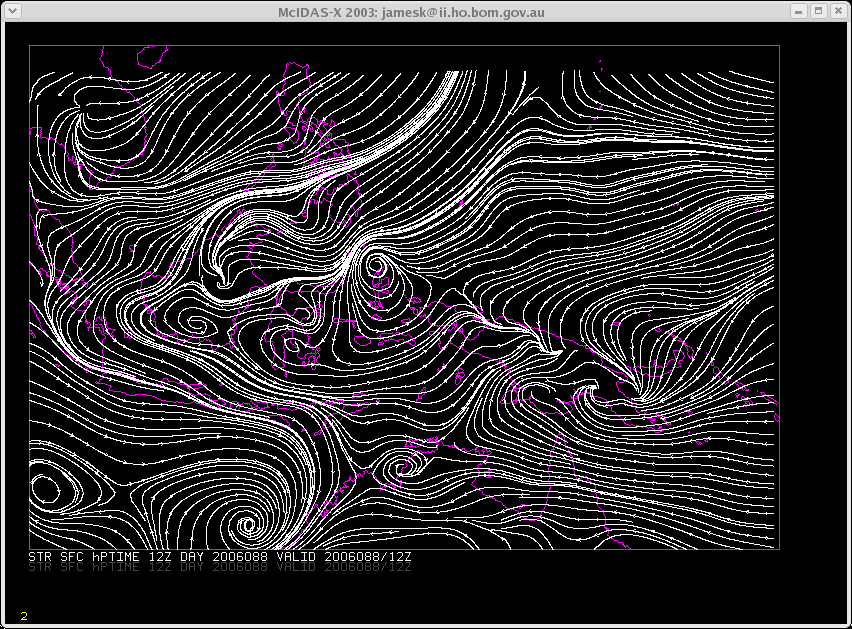
1) In McIDAS I did this:
GRDDISP <modelname> FHOUR=0 PARAM=STREAML LEV=SFC LAT=-20 20 LON=-160
-100 CINT=0 COLOR=15
Image is attached as "mcidas_streamline.png"
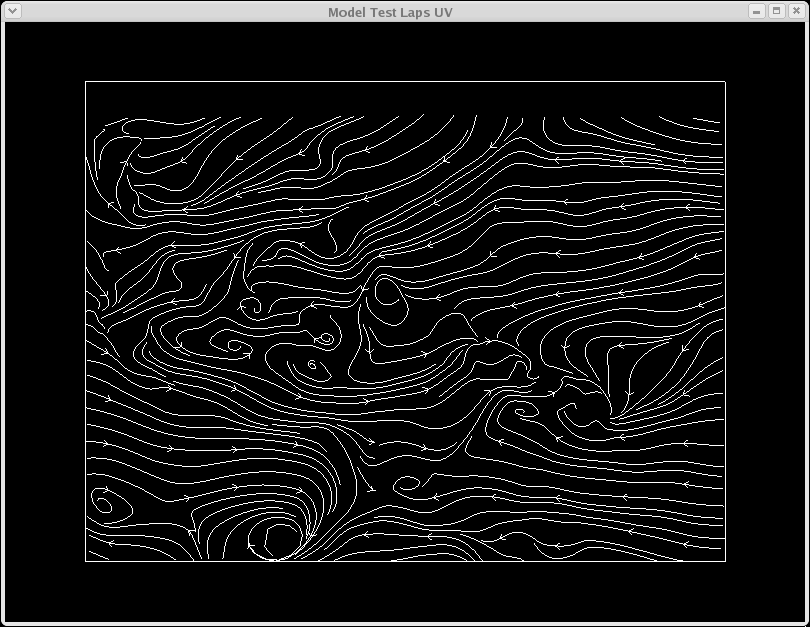
2) In Visad/jython I did this:
maps = (xMap, yMap, rngUMap, rngVMap)
disp = subs.makeDisplay(maps)
flowcontrol = rngUMap.getControl()
flowcontrol.enableStreamlines(TRUE)
strmDensity = flowcontrol.getStreamlineDensity()
stepFactor = flowcontrol.getStepFactor()
flowcontrol.setStreamlineDensity(10000.0)
print " streamline density " , strmDensity, " stepFactor ", stepFactor
drLAPSuv=subs.addData("windbarbs", uv, disp)
Image is attached as "visad_streamline.png"
Cheers,
James
--
James Kelly
Australian Bureau of Meteorology