- To: visad@xxxxxxxxxxxxxxxx
- Subject: [visad] Issues with zero-values on flow mapping
- From: Sebastian Fuchs <spacehorst@xxxxxxxxx>
- Date: Tue, 3 Mar 2009 18:56:23 +0100
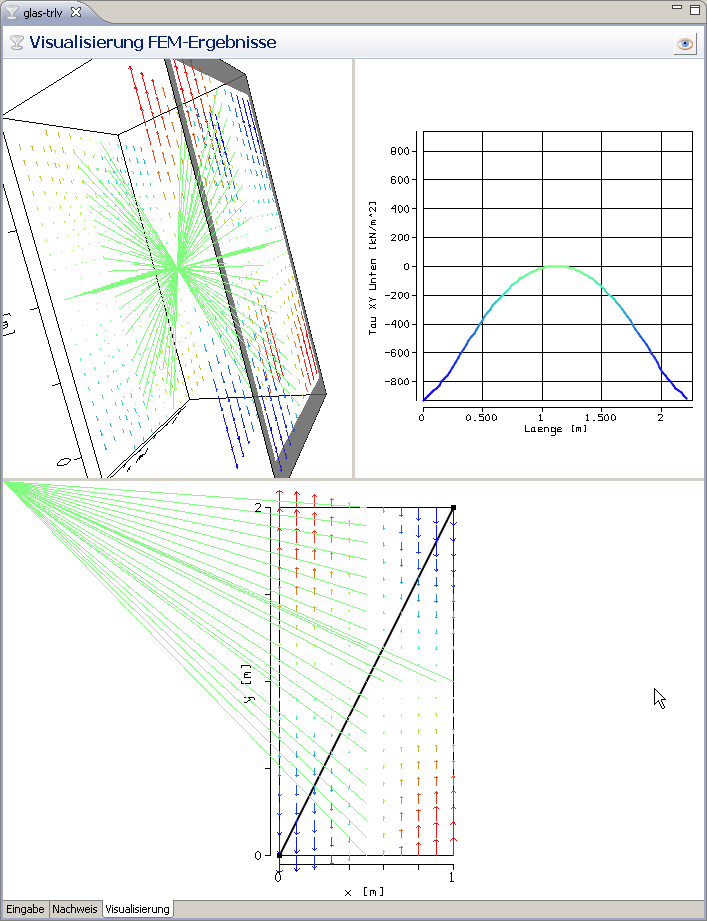
Hello,

I visualize data from a finite element analysis with VisAD Tue Dec 23
13:47:46 CST 2008.

When I try to map the x-, y- and z-components of tensions to Display.Flow1X
... Display.Flow1Z,
those arrows are not painted correctly where all components equal to 0.0f .

This applies to 2D and 3D displays. Please see the attached screenshot.

What am I doing wrong ?
--
Dipl.-Ing. Sebastian Fuchs
Walter-Arnold-Straße 8
01219 Dresden

fon: +49 (351) 2728098
mobile: +49 (176) 96338376
icq: 114494140
Attachment:
tension_components.png
Description: PNG image
- Follow-Ups:
- Re: [visad] Issues with zero-values on flow mapping
- From: Tom Rink
- Re: [visad] Issues with zero-values on flow mapping