Hi All-
I have a set of images that show the data of a narrow band of the earth.
The MathType is:
(Time-> ((ImageElement, ImageLine) -> Band1))

with a CoordinateSystem of:

(ImageElement, ImageLine) ==> (Latitude, Longitude)

Normally, I map:

Latitude->Y Axis
Longitude -> X Axis
Band1 -> RGB
Time -> Animation
to do a time animation of the images. What I would like to do is
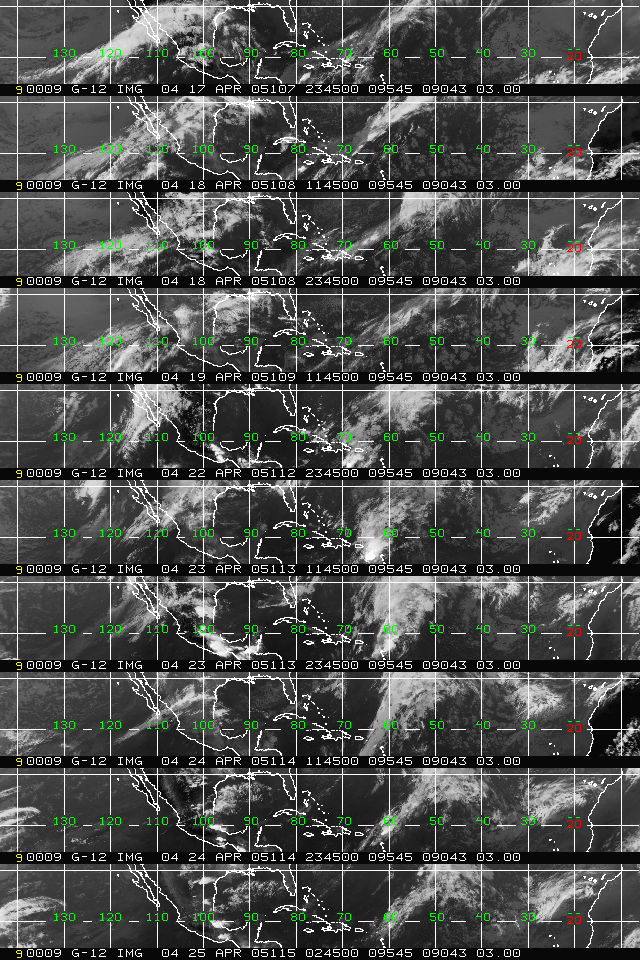
generate a Hovmoller diagram where Time is the Y axis and the images are
stacked along in time, such as the image here:
http://www.nhc.noaa.gov/gifs/gehov2.gif
What ScalarMaps would I need and/or how would I need to munge the data
to accomplish this?
Thanks for your help.

Don
--
Don Murray
NOAA/ESRL/PSD and CIRES
303-497-3596
http://www.esrl.noaa.gov/psd/people/don.murray/