Hello,
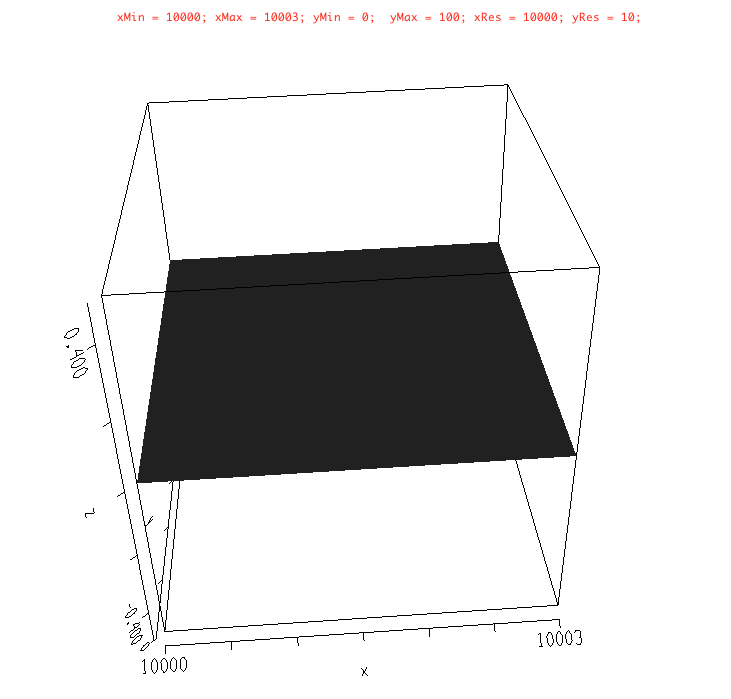
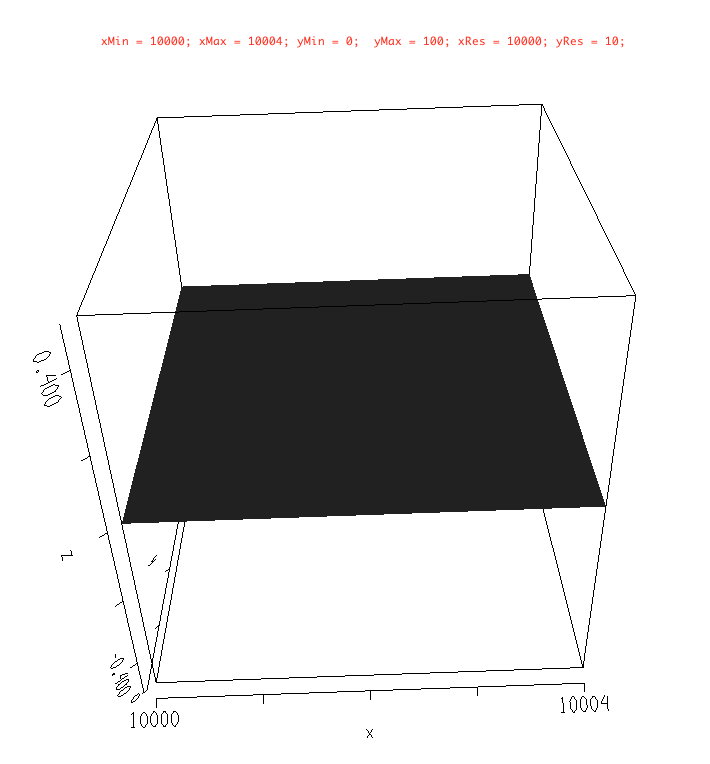
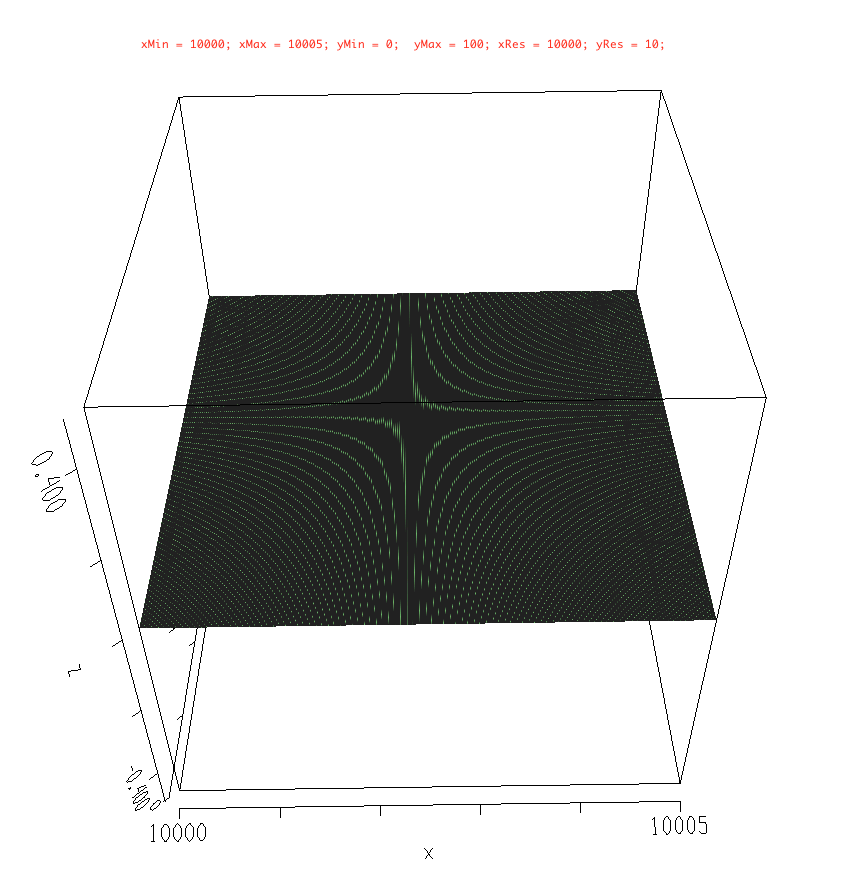
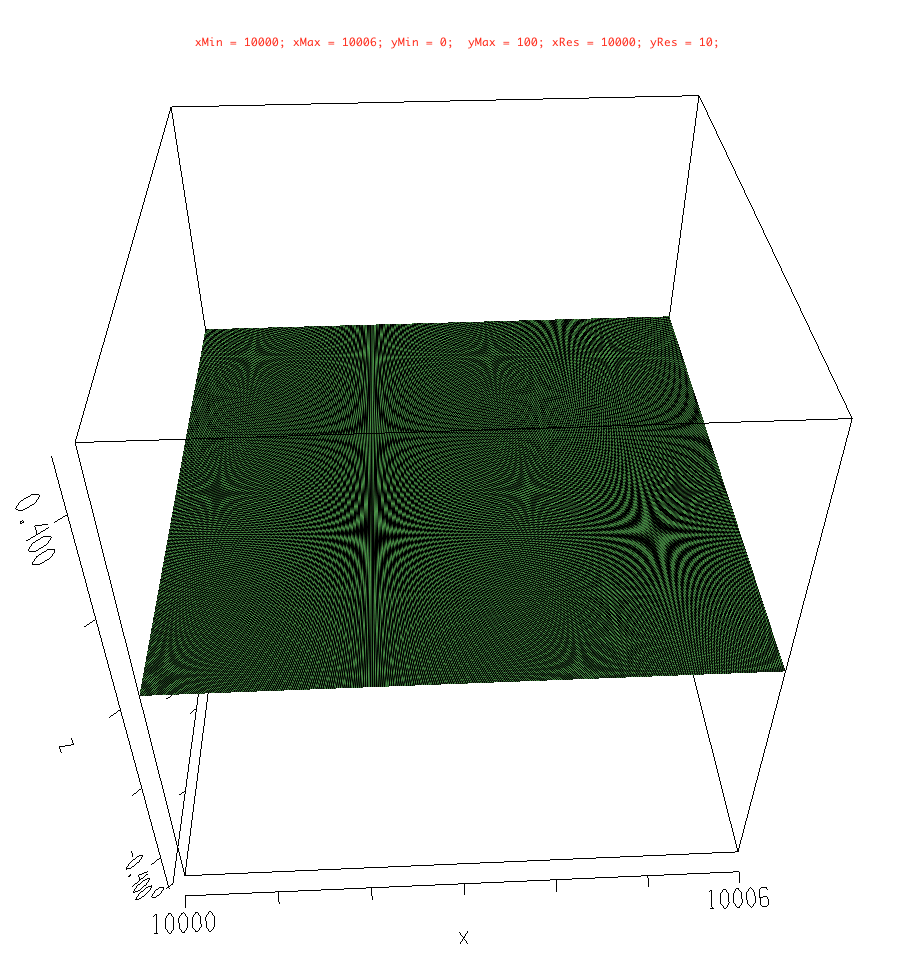
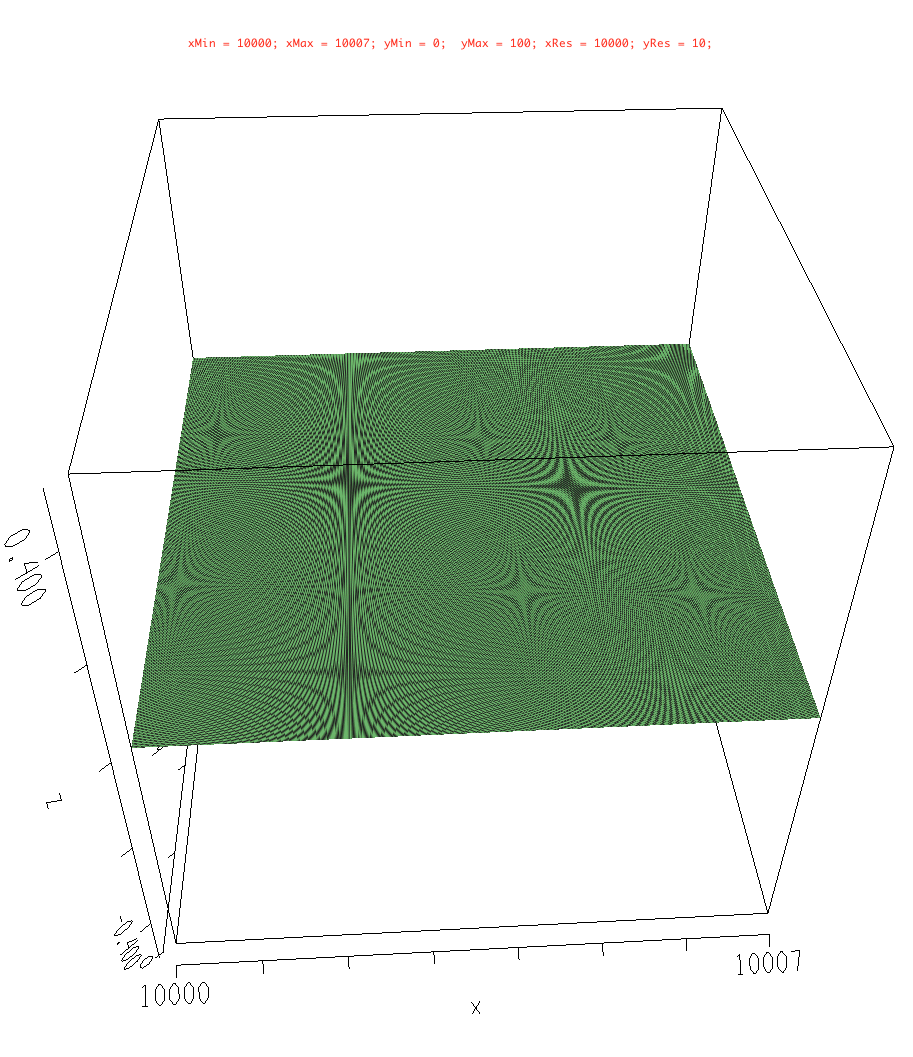
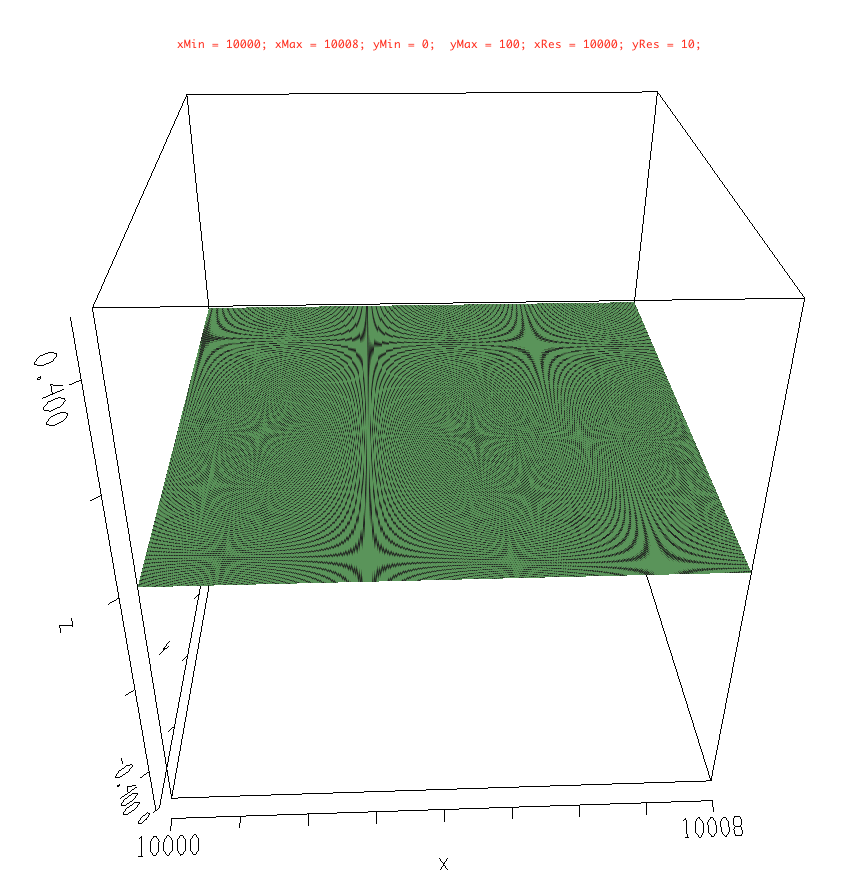
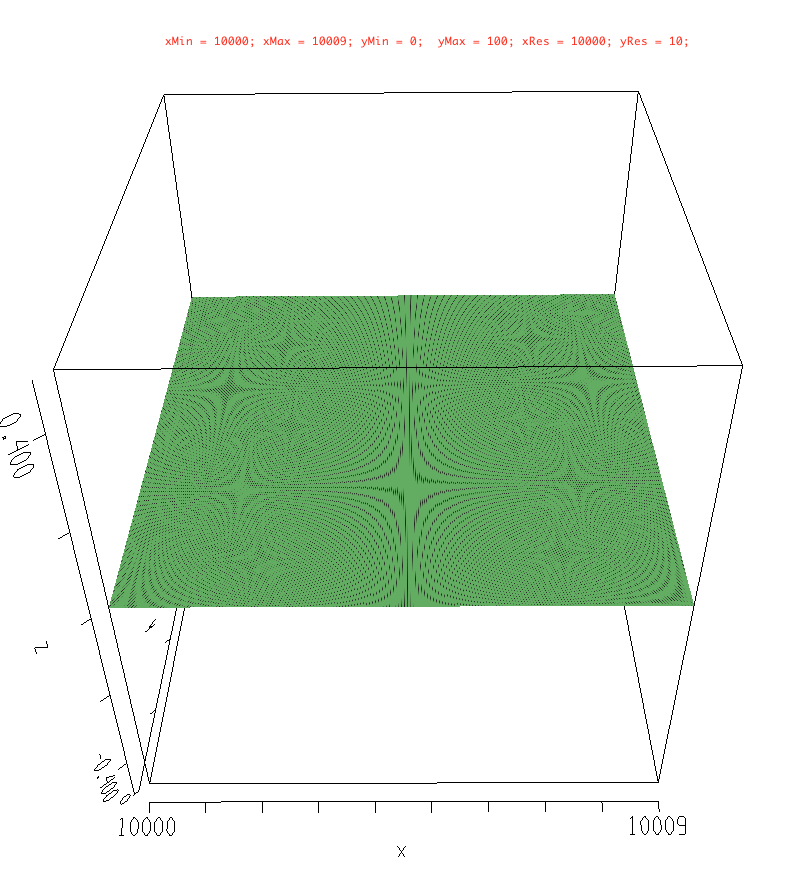
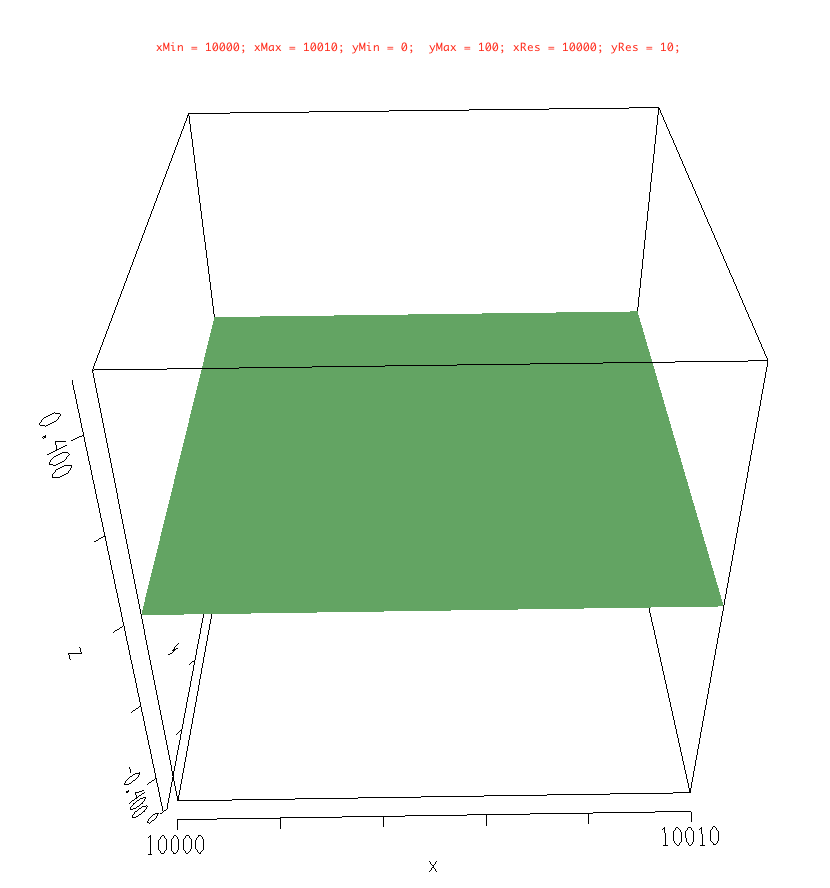
As I am trying to look into this issue, I made a few more screenshots that
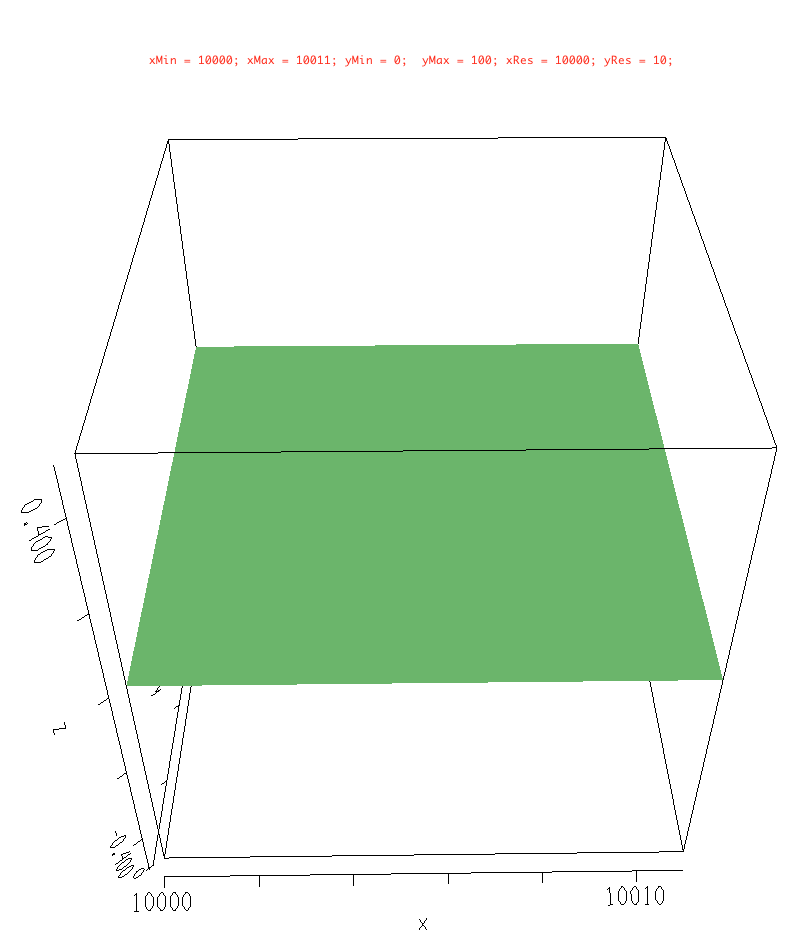
demonstrate what kind of patterns I see as I change the axis range only
slightly..
Note that only the xMax variable is changing in these plots, from 10003 to
10011.
I am not sure why with lower xMax values the whole pattern turns black..
The screenshots were generated using the same VisadTest.java program that I
sent last time.
Best regards,
Tomas
[cid:A18A5FC0-A3F4-41DB-8FDB-9908DA4339C9@oist.jp][cid:340541C2-682A-473B-8CA7-168D12E98325@oist.jp][cid:34AA787C-AD18-46D6-89EC-AB05EB4866F2@oist.jp][cid:B5672D5E-9614-4D31-925B-4B705184DD16@oist.jp][cid:A84A6739-58F8-4703-B828-33D1C85C0FE3@oist.jp][cid:F5CDAE36-D8F6-4C5F-8E22-FEA9C7055B36@oist.jp][cid:80D814D8-472F-492A-8FFE-10E9153299DC@oist.jp][cid:BB7C0E85-FB6D-427E-A3FA-36156A4ADABB@oist.jp][cid:B53516CD-558A-4237-869E-AA69AF29C743@oist.jp]
===============================================
Tomáš Pluskal
G0 Cell Unit, Okinawa Institute of Science and Technology Graduate University
1919-1 Tancha, Onna-son, Okinawa 904-0495, Japan
TEL: +81-98-966-8684
Fax: +81-98-966-2890