- To: Pete Pokrandt <poker@xxxxxxxxxxxx>
- Subject: Re: [ldm-users] Problem calculating GOES-16 brightness temperature from radiance
- From: Arthur A Person <aap1@xxxxxxx>
- Date: Fri, 26 Jan 2018 12:12:20 -0500 (EST)
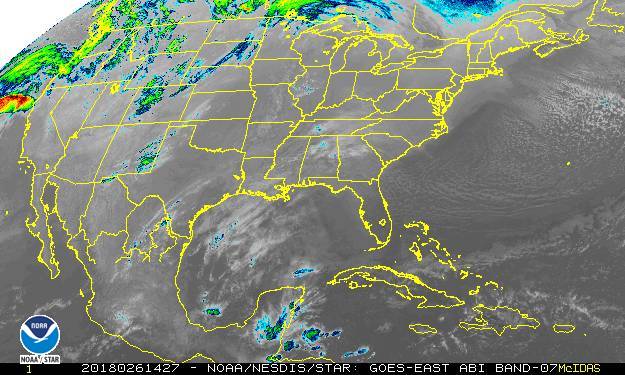
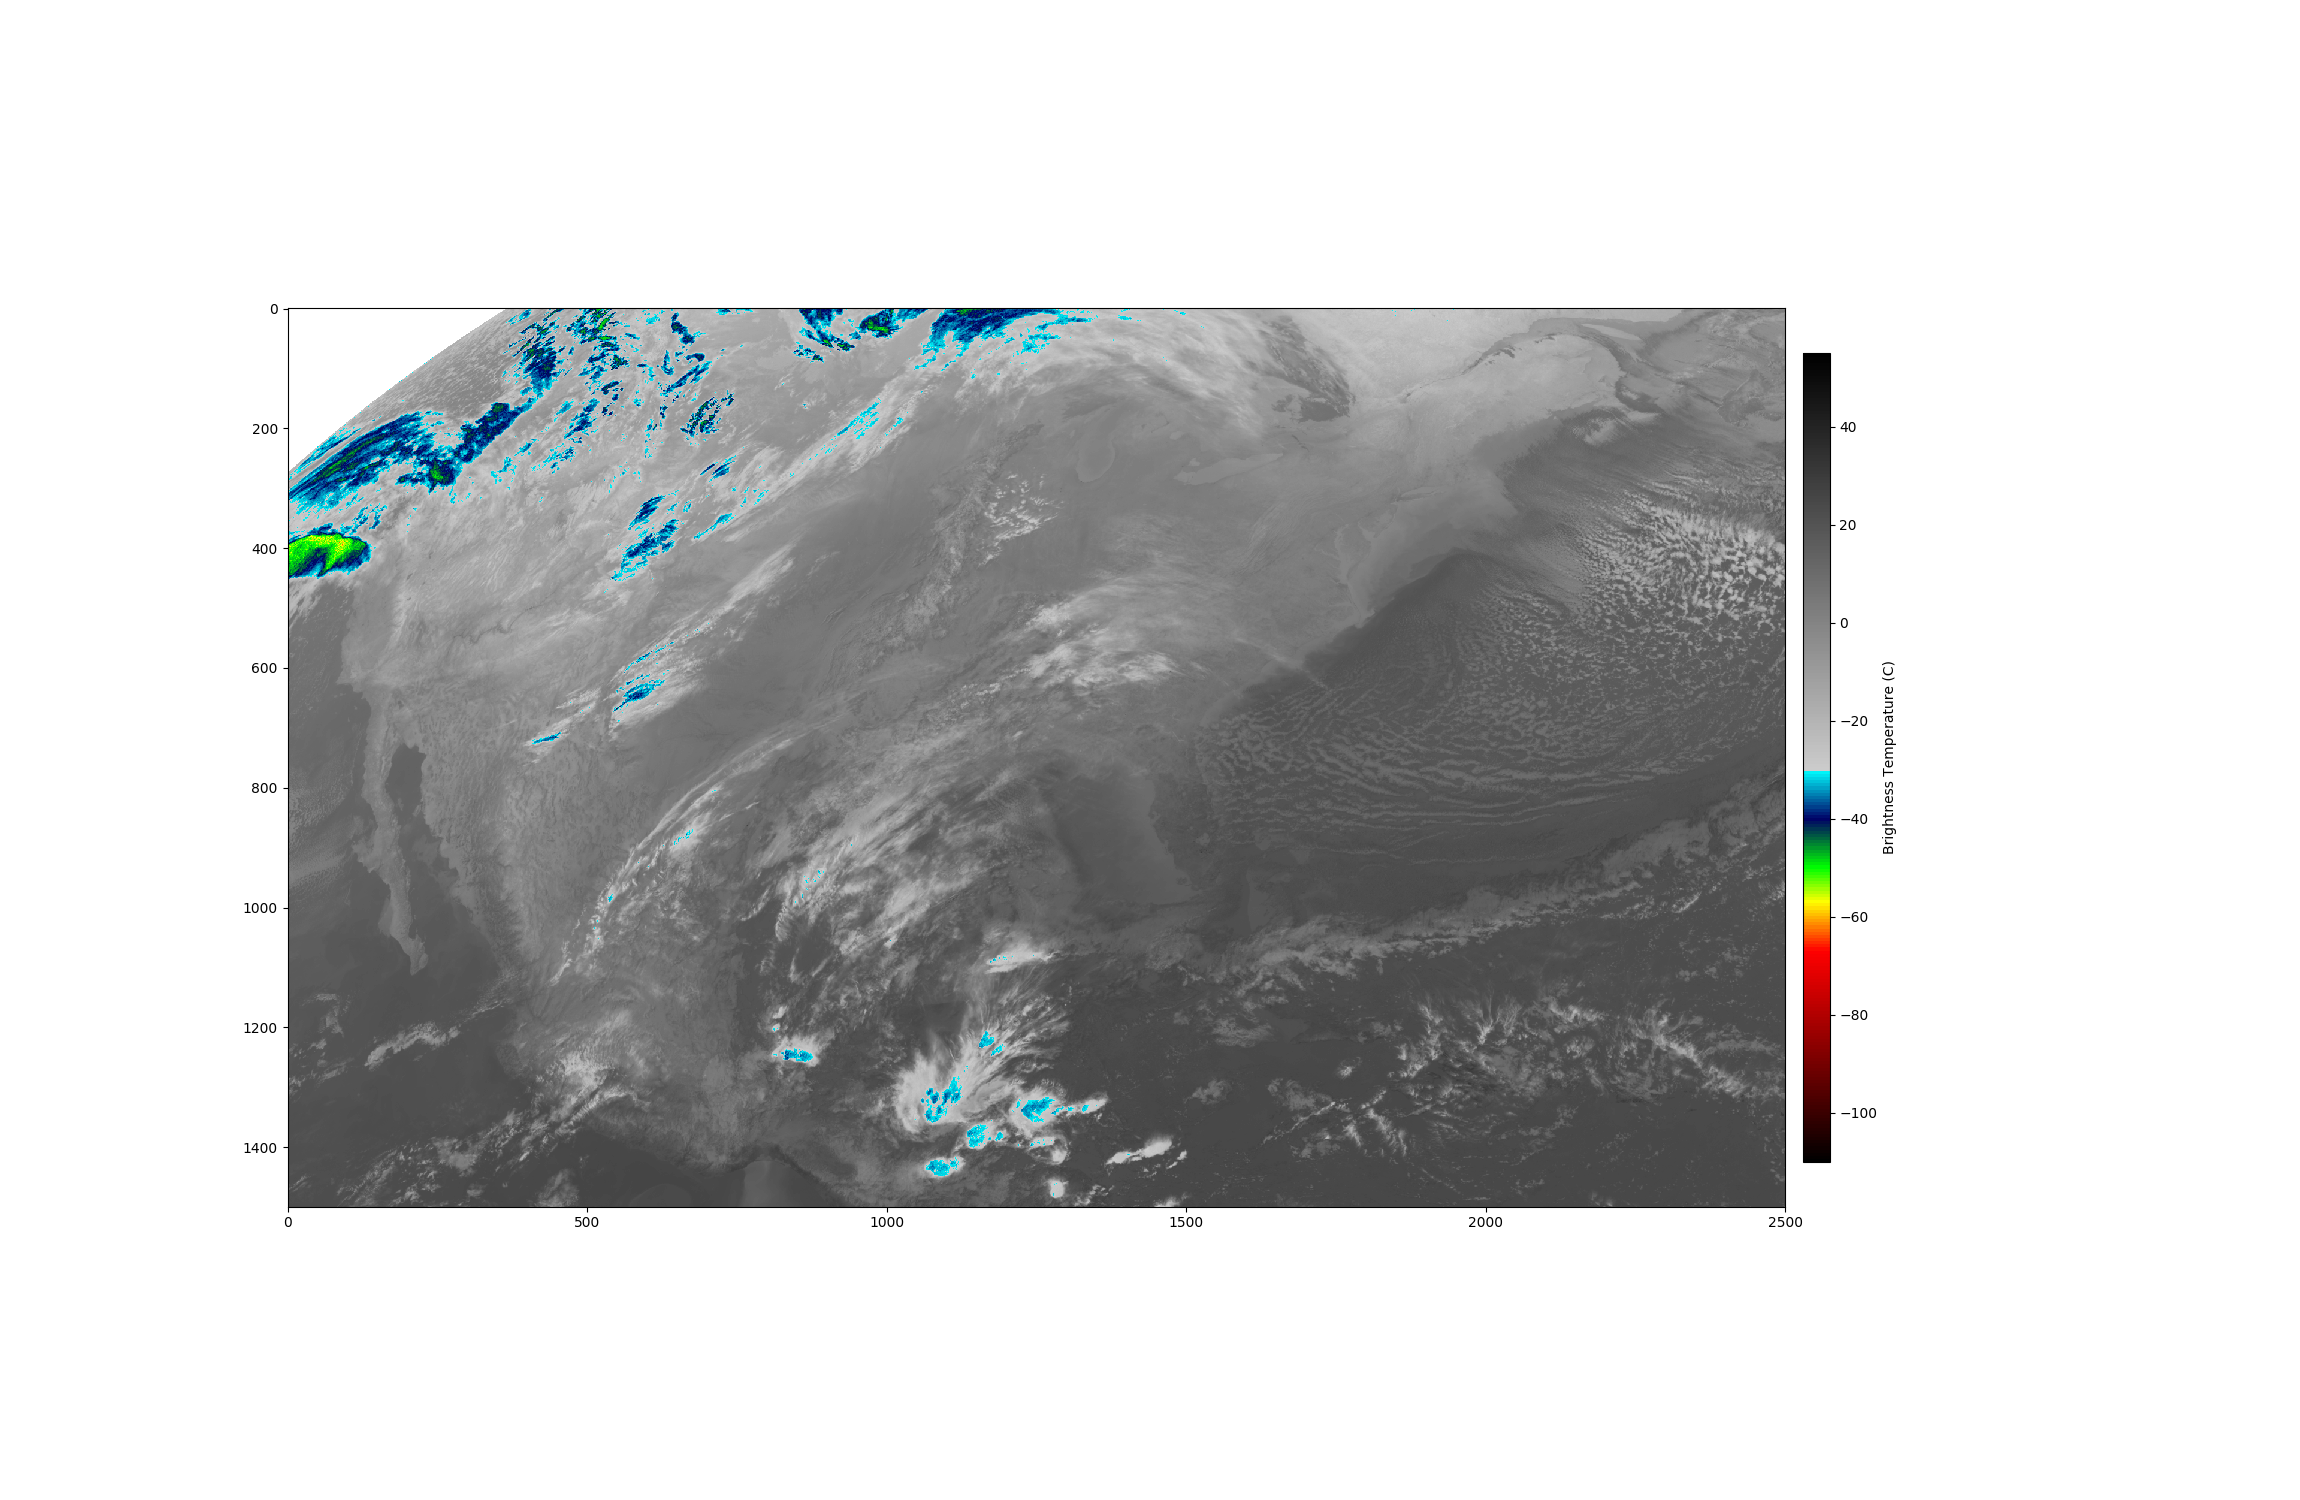
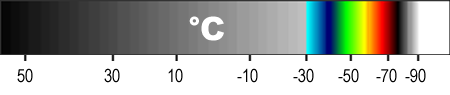
Pete,

Here's what I see in the imagery you provided:

Examining the cloud feature in the Bay of Campeche for channel 13, the AOS
image shows bright greens to a peak near orange which I would value in a range
from 215 to 230 K (-58 to -43 C) using the AOS scale. For the NESDIS image, the
colors
range from navy blue to moderately bright green. Using the NESDIS scale you
attached,
I would value that range from -55 to -40 C. The difference between these two
images is
about 3 C which I would attribute to the limits of the subjective evaluation of
the color ranges.

Doing the same for channel 7, the AOS image shows light blues to navy blue
which I would
value in a range from 242 to 252 K (-31 to -21 C) using the AOS scale. For the
NESDIS image,
the colors range from light blue (or even starts in the gray) to navy blue or a
range of about
-40 to -25 C. The warmer end of this range is within the limitations of
guessing at the color values,
but the colder end is about 10 C different. Put another way, both the AOS and
NESDIS images
show about the same color for the coldest clouds (navy blue), but navy blue on
the AOS curve
is about 243 K (-30 C) versus -40 C for the NESDIS curve.

The difference is more apparent when you replicate the NESDIS curve and plot
the images comparing
them side by side. I've attached channel 7 imagery from NESDIS and also what I
created from the GRB
data for 14:27Z this morning to show what I mean (although there's not a lot of
high cloud out there today).
The ColorBar image applies to the NESDIS image and I've tried to replicate that
in my image. I'm convinced
there's a difference in what's being shown on the NESDIS site versus what we're
calculating from the GRB
data... but why? It only appears to be channel 7 related, although I haven't
looked at other channels besides
13 (which you provided here) and 14.

Art

> From: "Pete Pokrandt" <poker@xxxxxxxxxxxx>
> To: "ARTHUR AUGUST PERSON" <aap1@xxxxxxx>
> Cc: "ldm-users" <ldm-users@xxxxxxxxxxxxxxxx>
> Sent: Thursday, January 25, 2018 5:20:24 PM
> Subject: Re: [ldm-users] Problem calculating GOES-16 brightness temperature
> from
> radiance

> Art,

> It's a little hard, since we are using slightly different color tables.

> The NESDIS color table (attached) first uses color - cyan- at -30C (243K) and
> then goes through a rainbow color table up to about -70C (203K) and then black
> to white.

> My color table, based on what I had seen CIMSS using, first uses cyan at 253K
> (-20C) and cycles through colors up to about 203K (also -70C).

> These same color tables are used for all of the IR images except the WV (so
> ABI
> 7 and 11-13)

> I've attached copies of the NESDIS and UW-AOS versions of both channels 7 and
> 13, all valid at 1930 UTC today, and the color table used by NESDIS since
> theirs are not on the image like mine are - and also an image from last April
> showing the IR color table that CIMSS used that I was trying to re[produce -
> although now that I look, I think my purple should go to 183K, not 180. That
> might be a bug for me, but only on the most cold temps.

> A visual comparison of both of these - their ABI7 to mine, and their ABI13 to
> mine - looks like we're the same, just using a different color scale..

> I also attempted to overlay their color scale with mine so the temps lined up
> (AOS_Color_Table_vs_NESDIS.png). The differences in our color scales would be
> most evident at warmer temps - so maybe they are more prominent at ABI 7 which
> is warmer than ABI 13 or 14, which are colder?

> Thoughts?

> Pete

> [
> http://www.weather.com/tv/shows/wx-geeks/video/the-incredible-shrinking-cold-pool
> ] --
> Pete Pokrandt - Systems Programmer
> UW-Madison Dept of Atmospheric and Oceanic Sciences
> 608-262-3086 - poker@xxxxxxxxxxxx

> From: Arthur A Person <aap1@xxxxxxx>
> Sent: Thursday, January 25, 2018 8:04 AM
> To: Pete Pokrandt
> Cc: ldm-users
> Subject: Re: [ldm-users] Problem calculating GOES-16 brightness temperature
> from
> radiance
> Pete,

> No, I didn't. With your plots, I just did some more checking... Approximating
> your curve, I got similar results
> using GRB data from amazon. However, when I switch back to approximating the
> curve on
> https://www.star.nesdis.noaa.gov/GOES/GOES16_FullDisk_Band.php?band=07&length=24
> and plotting, my image again appears warmer. How do your plots compare to
> what's
> on the star site?

> Thanks... Art

>> From: "Pete Pokrandt" <poker@xxxxxxxxxxxx>
>> To: "ARTHUR AUGUST PERSON" <aap1@xxxxxxx>
>> Cc: "ldm-users" <ldm-users@xxxxxxxxxxxxxxxx>
>> Sent: Wednesday, January 24, 2018 10:48:46 PM
>> Subject: Re: [ldm-users] Problem calculating GOES-16 brightness temperature
>> from
>> radiance

>> Art,

>> Did you ever get this figured out? I plotted up an ABI full disk image from
>> the
>> GRB Radiance data coming in from both the Unidata DIFAX feed and from the
>> tiled
>> NOAAPORT CMI data. They seem pretty much the same to me, considering
>> resolution
>> differences - 2km for GRB vs 6km for the NOAAPORT data.

>> GRB image - [
>> http://whirlwind.aos.wisc.edu/~wxp/goes16/test/201801210430_fulldisk_grb.jpg
>> |
>> http://whirlwind.aos.wisc.edu/~wxp/goes16/test/201801210430_fulldisk_grb.jpg
>> ]

>> NOAAPORT image - [
>> http://whirlwind.aos.wisc.edu/~wxp/goes16/test/201801210430_fulldisk.jpg |
>> http://whirlwind.aos.wisc.edu/~wxp/goes16/test/201801210430_fulldisk.jpg ]

>> Pete

>> [
>> http://www.weather.com/tv/shows/wx-geeks/video/the-incredible-shrinking-cold-pool
>> ] --
>> Pete Pokrandt - Systems Programmer
>> UW-Madison Dept of Atmospheric and Oceanic Sciences
>> 608-262-3086 - poker@xxxxxxxxxxxx

>> From: ldm-users-bounces@xxxxxxxxxxxxxxxx
>> <ldm-users-bounces@xxxxxxxxxxxxxxxx> on
>> behalf of Arthur A Person <aap1@xxxxxxx>
>> Sent: Monday, January 15, 2018 4:45 PM
>> To: ldm-users
>> Subject: Re: [ldm-users] Problem calculating GOES-16 brightness temperature
>> from
>> radiance
>> All --

>> I'm starting to think there may be a problem with the GOES-16 channel 7 GRB
>> NetCDF data. I wrote a short test code
>> (included below) that calculates brightness temperature and produces a png
>> file
>> with an abbreviated color table for comparison
>> with the NESDIS https://www.star.nesdis.noaa.gov/GOES/GOES16_CONUS.php
>> imagery.
>> When using the channel 7 data,
>> the calculated imagery appears noticeably warmer, but when using channel 14
>> data
>> (for example), the images appear
>> very close in value.

>> Would someone else mind taking a look at this and confirm whether this might
>> be
>> the case, or whether I'm just losing my mind?

>> Thanks!
>> Art

>> _________________________________________________________________________________________________________

>> from netCDF4 import Dataset
>> import numpy as np
>> import matplotlib.pyplot as plt
>> from matplotlib.colors import LinearSegmentedColormap

>> filename =
>> "amazon/OR_ABI-L1b-RadC-M3C07_G16_s20180151547235_e20180151550019_c20180151550058.nc"
>> #filename =
>> "amazon/OR_ABI-L1b-RadC-M3C14_G16_s20180151547235_e20180151550008_c20180151550050.nc"

>> dataset = Dataset(filename,'r')

>> # Get coefficients for calculation of brightness temperature
>> planck_fk1 = dataset.variables['planck_fk1'][:]
>> planck_fk2 = dataset.variables['planck_fk2'][:]
>> planck_bc1 = dataset.variables['planck_bc1'][:]
>> planck_bc2 = dataset.variables['planck_bc2'][:]
>> print("planck_fk1: ",planck_fk1)
>> print("planck_fk2: ",planck_fk2)
>> print("planck_bc1: ",planck_bc1)
>> print("planck_bc2: ",planck_bc2)

>> # Read the radiance data
>> rad = dataset.variables['Rad'][:]

>> dataset.close()

>> # Calculate brightness temperature
>> bt = ( (planck_fk2 / (np.log( (planck_fk1/rad)+1 ))) - planck_bc1 ) /
>> planck_bc2
>> bt = bt - 273.15

>> # Create a color table to compare against
>> https://www.star.nesdis.noaa.gov/GOES/GOES16_CONUS.php imagery
>> red = []
>> green = []
>> blue = []
>> valmin=-110.
>> valmax=55.
>> red.append( [0.0, 0.0, 0.0] )
>> green.append( [0.0, 0.0, 0.0] )
>> blue.append( [0.0, 0.0, 0.0] )
>> red.append( [ (-50.0-valmin)/(valmax-valmin), 0.0, 0.0 ] )
>> green.append( [ (-50.0-valmin)/(valmax-valmin), 1.0, 1.0 ] )
>> blue.append( [ (-50.0-valmin)/(valmax-valmin), 0.0, 0.0 ] )
>> red.append( [ (-40.0-valmin)/(valmax-valmin), 0.0, 0.0 ] )
>> green.append( [ (-40.0-valmin)/(valmax-valmin), 0.0, 0.0 ] )
>> blue.append( [ (-40.0-valmin)/(valmax-valmin), 0.4, 0.4 ] )
>> red.append( [ (-30.0-valmin)/(valmax-valmin), 0.0, 0.8 ] )
>> green.append( [ (-30.0-valmin)/(valmax-valmin), 1.0, 0.8 ] )
>> blue.append( [ (-30.0-valmin)/(valmax-valmin), 1.0, 0.8 ] )
>> red.append( [ 1.0, 0.0, 0.0 ] )
>> green.append( [ 1.0, 0.0, 0.0 ] )
>> blue.append( [ 1.0, 0.0, 0.0 ] )
>> cdict = {'red': red, 'green': green, 'blue': blue}
>> ctbl = LinearSegmentedColormap('custom', cdict)

>> # Set the figure size
>> fig = plt.figure(1, figsize=(23, 15))

>> # Display the image
>> im = plt.imshow(bt, cmap=ctbl, vmin=valmin, vmax=valmax )

>> # Display a color bar
>> cb = plt.colorbar( orientation='vertical', shrink=0.7, pad=0.01, aspect=30 )
>> cb.set_label("Brightness Temperature (C)")

>> # Save the image to a png file
>> plt.savefig('plot.png', dpi=100)

>>> From: "Pete Pokrandt" <poker@xxxxxxxxxxxx>
>>> To: "ARTHUR AUGUST PERSON" <aap1@xxxxxxx>
>>> Cc: "ldm-users" <ldm-users@xxxxxxxxxxxxxxxx>
>>> Sent: Saturday, January 13, 2018 9:03:11 PM
>>> Subject: Re: [ldm-users] Problem calculating GOES-16 brightness temperature
>>> from
>>> radiance

>>> Forgot to cc to the list.

>>> Here's a commented version of the script that I'm currently using to plot
>>> ABI
>>> channel 13 (clear channel IR window) but the calculation for BT should work
>>> for
>>> any of the channels 7-16.

>>> I am using just the radiance values read in from the netcdf files, without
>>> applying any scale/offset to them. Perhaps the netcdf4 read does that for
>>> us? I
>>> am reading the scale and offset info in for reference, and printing them
>>> out,
>>> but I am not using them in my calculations at all.

>>> If for some reason, the attachment doesn't come through, you can get the
>>> file at

>>> [ http://sysadm.aos.wisc.edu/~poker/goes16_GRB_fulldisk_IR13_ircm.py |
>>> http://sysadm.aos.wisc.edu/~poker/goes16_GRB_fulldisk_IR13_ircm.py ]

>>> Hope this helps,
>>> Pete

>>> [
>>> http://www.weather.com/tv/shows/wx-geeks/video/the-incredible-shrinking-cold-pool
>>> ] --
>>> Pete Pokrandt - Systems Programmer
>>> UW-Madison Dept of Atmospheric and Oceanic Sciences
>>> 608-262-3086 - poker@xxxxxxxxxxxx

>>> From: Arthur A Person <aap1@xxxxxxx>
>>> Sent: Saturday, January 13, 2018 9:04 AM
>>> To: Pete Pokrandt
>>> Cc: ldm-users
>>> Subject: Re: [ldm-users] Problem calculating GOES-16 brightness temperature
>>> from
>>> radiance
>>> Pete,

>>> Thanks for the help. Actually, I already tried adding parens to the
>>> equation,
>>> including the variation you
>>> suggested, but the results are the same. Do you have a few lines of code
>>> that
>>> worked for you that you'd
>>> be willing to share? Or, do you recall whether there's any issue with netCDF
>>> auto-scaling the input data,
>>> or any units conversion that has to be included that's not in the
>>> documentation?

>>> Thanks... Art

>>>> From: "Pete Pokrandt" <poker@xxxxxxxxxxxx>
>>>> To: "ARTHUR AUGUST PERSON" <aap1@xxxxxxx>, "ldm-users"
>>>> <ldm-users@xxxxxxxxxxxxxxxx>
>>>> Sent: Friday, January 12, 2018 11:47:08 AM
>>>> Subject: Re: [ldm-users] Problem calculating GOES-16 brightness
>>>> temperature from
>>>> radiance

>>>> Art,

>>>> I think it may be a parenthesis/order of operations issue. I seem to recall
>>>> having this same issue when I first started working with the GRB data.

>>>> Try this:

>>>> bt = ( planck_fk2 / ( np.log((planck_fk1 / rad) + 1 )) - planck_bc1) /
>>>> planck_bc2

>>>> Pete

>>>> From: ldm-users-bounces@xxxxxxxxxxxxxxxx
>>>> <ldm-users-bounces@xxxxxxxxxxxxxxxx> on
>>>> behalf of Arthur A Person <aap1@xxxxxxx>
>>>> Sent: Friday, January 12, 2018 7:43 AM
>>>> To: ldm-users@xxxxxxxxxxxxxxxx
>>>> Subject: [ldm-users] Problem calculating GOES-16 brightness temperature
>>>> from
>>>> radiance
>>>> Hi...

>>>> I'm trying to calculate brightness temperature from radiance for GOES-16 IR
>>>> channel 7 using rebroadcast data
>>>> but my values compared to McIDAS imagery are coming out 15 to 20 degrees C
>>>> too
>>>> warm. I'm using the following
>>>> values and code:

>>>> Test imagery:
>>>> OR_ABI-L1b-RadC-M3C07_G16_s20180112232223_e20180112235008_c20180112235045.nc

>>>> rad (radiance) is read in from and auto-scaled by netCDF,
>>>> planck_fk1: 202263.0
>>>> planck_fk2: 3698.18994140625
>>>> planck_bc1: 0.4336099922657013
>>>> planck_bc2: 0.9993900060653687

>>>> bt = ( planck_fk2 / np.log( (planck_fk1/rad)+1 ) - planck_bc1 ) /
>>>> planck_bc2
>>>> bt = bt - 273.15

>>>> Can anyone tell me if I'm missing a step or spot a dumb mistake?

>>>> Thanks... Art

>>>> --
>>>> Arthur A. Person
>>>> Assistant Research Professor, System Administrator
>>>> Penn State Department of Meteorology and Atmospheric Science
>>>> email: aap1@xxxxxxx, phone: 814-863-1563

>>> --
>>> Arthur A. Person
>>> Assistant Research Professor, System Administrator
>>> Penn State Department of Meteorology and Atmospheric Science
>>> email: aap1@xxxxxxx, phone: 814-863-1563

>> --
>> Arthur A. Person
>> Assistant Research Professor, System Administrator
>> Penn State Department of Meteorology and Atmospheric Science
>> email: aap1@xxxxxxx, phone: 814-863-1563

> --
> Arthur A. Person
> Assistant Research Professor, System Administrator
> Penn State Department of Meteorology and Atmospheric Science
> email: aap1@xxxxxxx, phone: 814-863-1563

--
Arthur A. Person
Assistant Research Professor, System Administrator
Penn State Department of Meteorology and Atmospheric Science
email: aap1@xxxxxxx, phone: 814-863-1563
Attachment:
20180261427_GOES16-ABI-CONUS-07-625x375.jpg
Description: JPEG image
Attachment:
C07_20180261427.png
Description: PNG image
Attachment:
ColorBar450Bands7_13_horz.png
Description: PNG image
- Follow-Ups:
- Re: [ldm-users] Problem calculating GOES-16 brightness temperature from radiance
- From: Arthur A Person
- Re: [ldm-users] Problem calculating GOES-16 brightness temperature from radiance
- References:
- [ldm-users] Problem calculating GOES-16 brightness temperature from radiance
- From: Arthur A Person
- Re: [ldm-users] Problem calculating GOES-16 brightness temperature from radiance
- From: Pete Pokrandt
- Re: [ldm-users] Problem calculating GOES-16 brightness temperature from radiance
- From: Arthur A Person
- Re: [ldm-users] Problem calculating GOES-16 brightness temperature from radiance
- From: Pete Pokrandt
- Re: [ldm-users] Problem calculating GOES-16 brightness temperature from radiance
- From: Arthur A Person
- Re: [ldm-users] Problem calculating GOES-16 brightness temperature from radiance
- From: Pete Pokrandt
- Re: [ldm-users] Problem calculating GOES-16 brightness temperature from radiance
- From: Arthur A Person
- Re: [ldm-users] Problem calculating GOES-16 brightness temperature from radiance
- From: Pete Pokrandt
- [ldm-users] Problem calculating GOES-16 brightness temperature from radiance